
Case Study 02
Business Finance Dashboard & Analytics System
Business Result
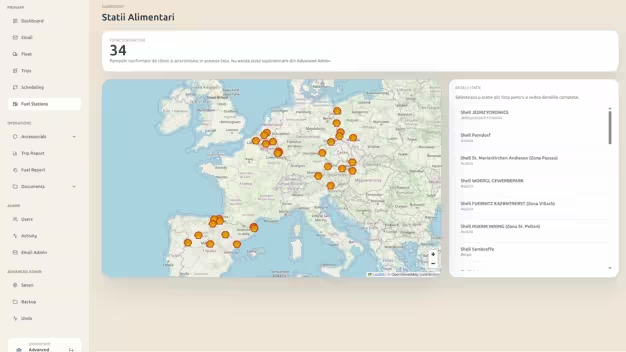
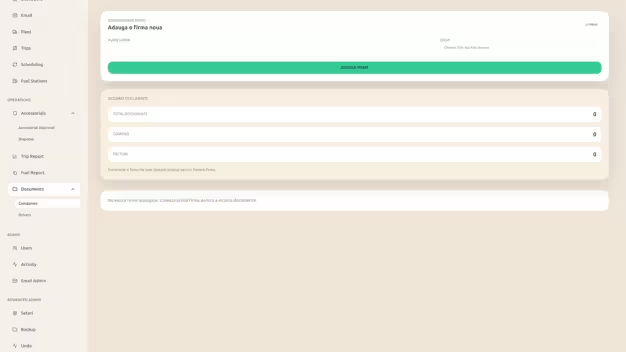
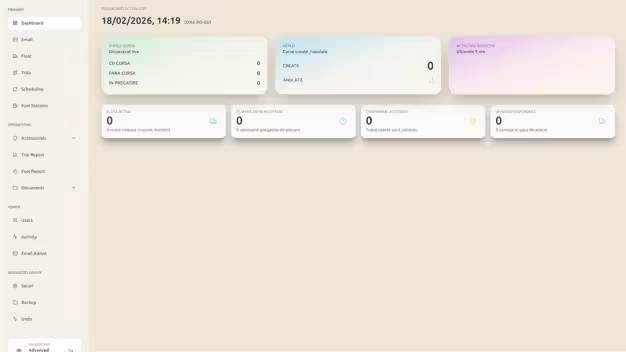
A premium dashboard system suitable for finance, operations, and leadership reporting.
The Requirement
The client needed a business dashboard where managers could see finance-style summaries, operational records, reports, user activity and key business indicators without depending on spreadsheets or disconnected tools.
The Challenge
The existing workflow had poor data visibility, slow manual reporting and unclear admin flow. Different users needed different access levels, reports had to be readable, and the interface needed to feel practical for daily use rather than looking like decorative charts with no business value.
The Goal
Give business users a finance dashboard that turns scattered operational numbers into usable decisions.
Strategy
The project was handled as Dashboard Development and ERP System Development planning: define the data first, map user roles, design reporting modules, then build interface sections around decisions the business actually needs to make.
Solution
Designed dashboard modules with analytics cards, report filters, table views, export-ready flows, responsive layouts, admin panels and clean data presentation. The structure is suitable for Laravel, REST API expansion and Custom Web Solutions Dubai workflows.
Features Delivered
Business Impact
The final system improved business visibility, reduced manual reporting effort and made operational numbers easier to trust. It supports High Performance Web Applications thinking with clean UI, better workflow clarity and scalable dashboard foundations.
How it was built
Aggregates, not live sums over the full history
A finance dashboard that recalculates totals across every transaction on each page load is fast in month one and unusable in year two. Figures that do not change once a period closes are rolled up on a schedule and read from summary tables; only the current open period is computed live.
That keeps response times flat as the data grows, and it makes the numbers reproducible — a closed month shows the same total tomorrow as it does today, which is the whole point of a finance report.
Role-based access enforced in the query, not the view
Payroll, margin and individual performance are exactly the figures that cause trouble when the wrong person sees them. Hiding elements in the interface while the API still returns the full payload is not access control; it is a leak with a cosmetic lid.
Each role therefore has its own query path — an owner view with the full picture, a manager view scoped to their branch or team, a staff view limited to their own records. The scope is applied where the data is fetched, so a request that should not see a number never receives it.
Filters and exports treated as real features
Report filters are where dashboards become slow, because a filter the schema was not indexed for turns every query into a full scan. The filters people actually use were decided before the indexes were written, rather than added afterwards and patched around.
Export matters more than it looks: the first thing many finance users do is take the report into Excel. A CSV that mangles dates, loses leading zeros on account codes or breaks on Arabic text undoes the work, so exports were built and tested as a deliverable rather than generated as an afterthought.